Site Logo PolarBase
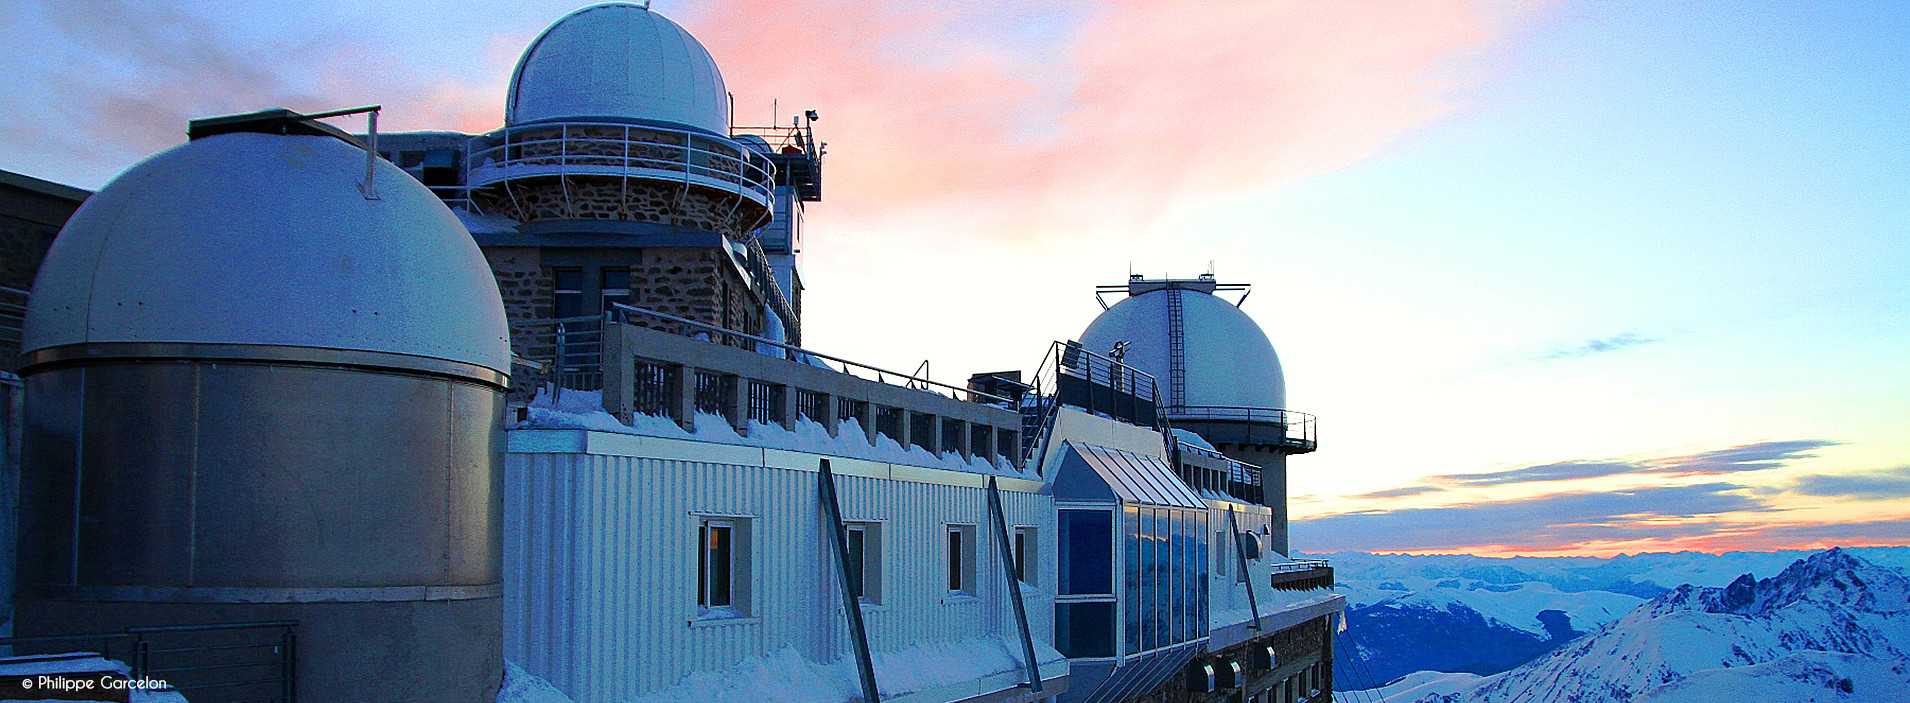
Photo of the Pic du Midi by Philippe Garcelon

PolarBase

A DataBase of high resolution spectropolarimetric stellar observations

Icon that allows you to view the article
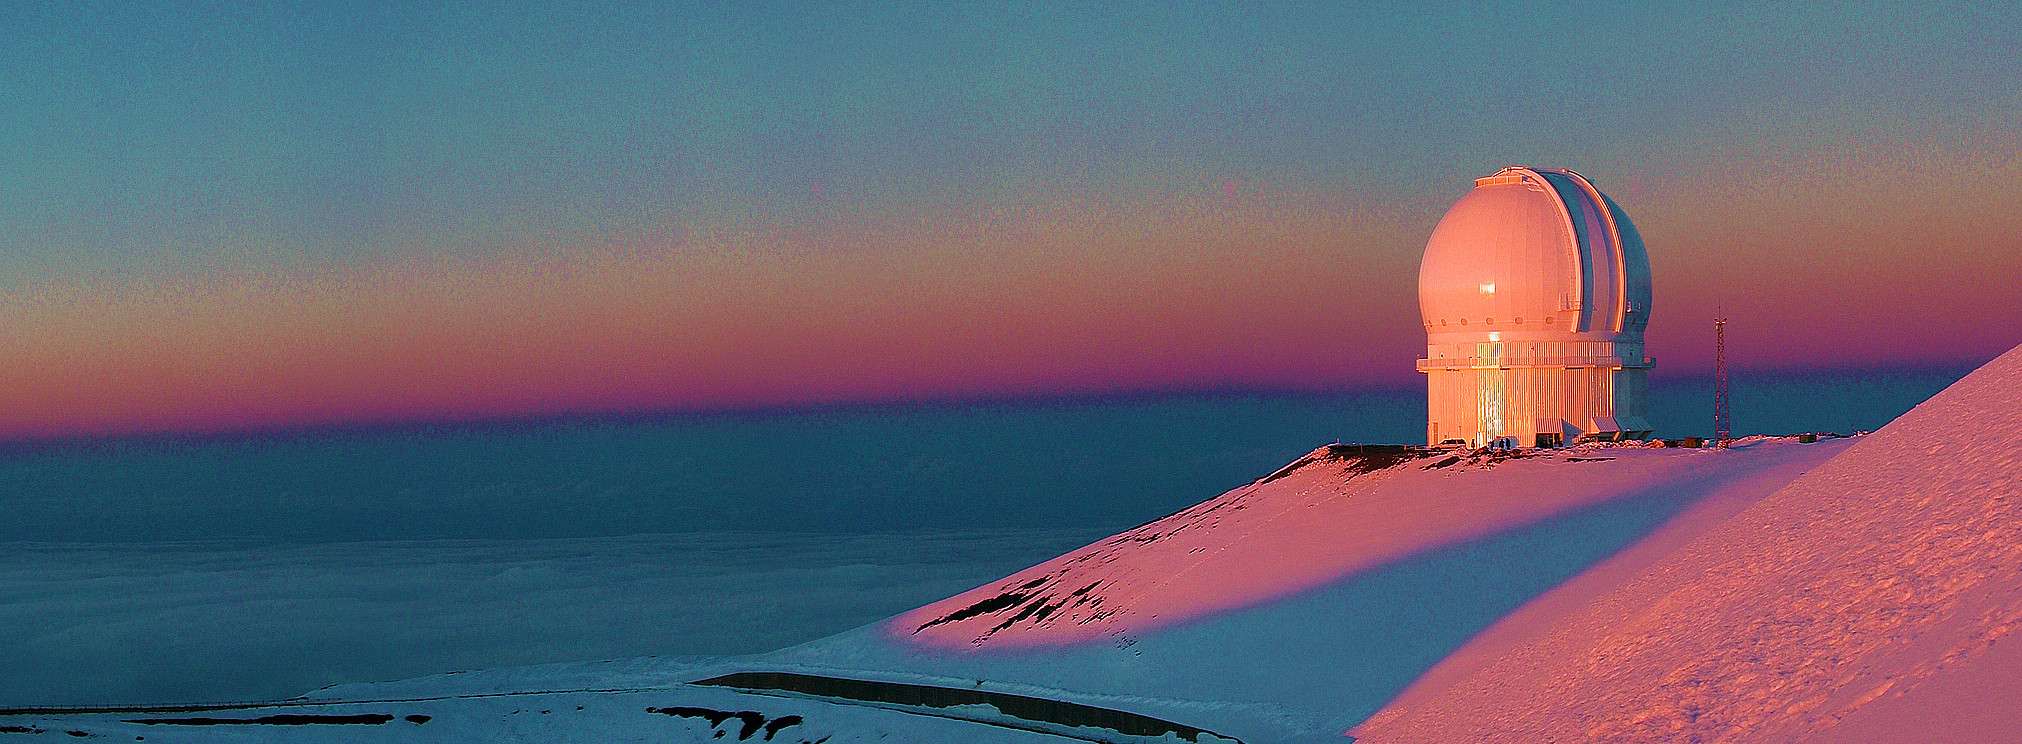
The CFHT dome on top of Mauna Kea - Hawaii

ESPaDOnS

Canada-France-Hawaii Telescope 2005

Icon that allows you to view the article
The TBL dome on top of Pic du Midi

NARVAL

Telescope Bernard Lyot 2006

Icon that allows you to view the article
Photo of the Canada-France-Hawaii telescope on Mauna Kea volcano

Data

Spectral domain and resolution

Icon that allows you to view the article

PolarBase

A DataBase of high resolution spectropolarimetric stellar observation

PolarBase is a live data base that contains all stellar data collected with the ESPaDOnS and NARVAL high-resolution spectropolarimeters, in their reduced form, as soon as they become public. As of 2013, observations of 2,000 stellar objects throughout the Hertzsprung-Russel diagram are available. Intensity spectra are available for all targets, and a majority of observations also include simultaneous spectra in circular or linear polarization, with a majority of polarimetric measurements performed in circularly polarized light alone (Stokes V). Observations are associated with a cross-correlation line profile in all available Stokes parameters, increasing greatly the detectability of weak polarized signatures. We report the detection of Stokes V signatures for more than 300 stars off all masses and evolutionary stages, and the detection of linear spectral line polarization in 35 targets. This unique set of Zeeman detections offers the first opportunity to run homogeneous magnetometry studies throughout the H-R diagram. The web interface of PolarBase is available at http://www.polarbase.irap.omp.eu.

If you plan to use PolarBase data in a scientific paper,please cite the following publication : http://adsabs.harvard.edu/abs/2014arXiv1401.1082P

ESPaDOnS

Canada-France-Hawaii Telescope 2005

Designed and constructed at Observatoire Midi-Pyrénées (OMP) in France, ESPaDOnS is a high-resolution stellar spectropolarimeter accessible to the whole CFHT community since semester 2005a.

Interior of the dome of the CFHT

NARVAL

Telescope Bernard Lyot 2006

NARVAL is a stellar spectropolarimeter copied from ESPaDOnS and adapted to the specifics of the 2m Telescope Bernard Lyot (TBL) atop Pic du Midi in southwest France. Constructed by the TBL team under supervision from the original ESPaDOnS team in Toulouse at Observatoire Midi-Pyrénées (OMP), it was installed at TBL and commissionned in November 2006, and offered to the OPTICON community in early December 2006.

NARVAL@TBL is the only astronomical facility worldwide fully dedicated to stellar spectropolarimetry, and in particular to the study of stellar magnetic fields: it thus offers large amounts of observing time to the community and allows to undertake long-term monitoring and surveys of brighter targets. NARVAL/TBL also makes it possible to carry out coordinated observations with ESPaDOnS to ensure almost continuous monitoring of rotating and variable stars, thanks to the 160° shift in longitude between France and Hawaii: stars now never set on ESPaDOnS and NARVAL!

Interior of the dome of the TBL

Data

Spectral domain and resolution

Image explaining the Spectral domain and his resolution Echelle orders

The image on the right represents an example flat field frame taken with ESPaDOnS in polarimetric mode (using light from a combination of tungsten lamps and filters so that all orders get a reasonable illumination level). Orders are clearly visible on this image, where they show up as bright slightly curved strips running vertically, successive orders being stacked next to each other from the left to the right of the ccd. As obvious from this image, the order separation varies with wavelength, being largest in the blue (right side of image) and smallest in the red (left side of image) as expected from a prism crossdisperser. A close up view of the small scale structure of the orders is displayed in the insert (bottom right of image), where the two spectra associated to each order in polarimetric mode (one spectrum per orthogonal state of the selected polarisation to be measured) are clearly visible.

Up to 40 orders are visible on the image, the first one being order #22 (centred at 1029nm) on the left side of the chip and the last one being order #61 (centred at 372nm) on the right side of the chip. Apart from very small gaps on the edges of the 3 reddest orders (between 922.4 and 923.4, 960.8 and 963.6nm, 1002.6 and 1007.4nm), the wavelength coverage is complete from 369 to 1048nm and can be obtained in a single exposure.

When reducing the data, the first operation consists at tracking the location and shape of all orders across the whole chip to a rms accuracy of better than 0.1pxl.

Wavelength calibration

The image on the right represents an example calibration frame taken with ESPaDOnS in polarimetric mode (using light from a combination of a thorium/argon and a thorium/neon lamp with filters to minimise the amount of strong red lines blooming the chip). As obvious from this image, a very large number of lines are present in each order, from which the accurate relation between pixel number along and across each order can be derived. The spectral resolution achieved is derived from the width of these lines.Image explaining the Spectral domain and his resolution A close up view of the individual thorium lines is shown in the insert (bottom right of image) where one can see again the dual structure of each order (the gap between the two spectra as well as the instrumental width of the lines (slightly lower than 2pxl).

An average number of about 50 lines per order (about 2,000 lines in total) are automatically searched for by the reduction routine and identified using reference lists of thorium line wavelengths; from these, wavelength calibration polynomials are produced over the full spectral range. The typical accuracy of this calibration is found to be of order of 0.06pxl or 150m/s at each given wavelength.The few remaining neon lines blooming the ccd in the red part of the domain do not really affect the precision of the calibration procedure.

Spectral resolution

By measuring the full width at half maximum of the individual thorium lines (reflecting mostly the instrumental broadening), one can determine the spectral resolution of ESPaDOnS in the selected instrument configuration (the reduction code does it automatically).

The graph on the right shows an example of such thorium lines (the strongest of the 3 being the ThI line at 550.75385nm). The full line indicates the wavelength calibrated spectrum around this line derived with ESPaDOnS being set in polarimetric mode, while the dashed line depicts that obtained in the 'object only' spectroscopic mode. The respective line widths (at half maximum) are respectively equal to 8.3 and 6.9pm, in agreement with the spectral resolutions of 68,000 and 81,000 associated to these modes.

These resolutions correpond to velocity elements of 4.4 and 3.7km/s respectively, to be compared to the 2.6km/s ccd pixel size and the 1.8km/s bin size on which the spectra are recovered.

© Jean-François Donati - http://www.ast.obs-mip.fr

Basic query

Object
OR
  • Any
  • Asymptotic Giant Branch Star (He-burning)
  • Be Star
  • Blue Straggler Star
  • Blue supergiant star
  • Carbon Star
  • Cepheid variable Star
  • Classical Cepheid (delta Cep type)
  • Composite object
  • CV of AM Her type (polar)
  • Double or multiple star
  • Dwarf Nova
  • Eclipsing binary
  • Eclipsing Binary Candidate
  • Eclipsing binary of Algol type (detached)
  • Eclipsing binary of beta Lyr type (semi-detached)
  • Eclipsing binary of W UMa type (contact binary)
  • Ellipsoidal variable Star
  • Emission-line Star
  • Eruptive variable Star
  • Evolved supergiant star
  • Flare Star
  • Herbig Ae/Be star
  • High Mass X-ray Binary
  • High proper-motion Star
  • Horizontal Branch Star
  • Hot subdwarf
  • Long Period Variable candidate
  • Long-period variable star
  • Low-mass star (M<1solMass)
  • Nova
  • Peculiar Star
  • Planetary Nebula
  • Possible Herbig Ae/Be Star
  • Possible Red Giant Branch star
  • Post-AGB Star (proto-PN)
  • Pre-main sequence Star
  • Pulsating variable Star
  • Red Giant Branch star
  • Red supergiant star
  • Rotationally variable Star
  • Spectroscopic binary
  • S Star
  • Star
  • Star in Nebula
  • SuperNova
  • Symbiotic Star
  • T Tau star Candidate
  • T Tau-type Star
  • Variable of BY Dra type
  • Variable of RS CVn type
  • Variable Star
  • Variable Star of alpha2 CVn type
  • Variable Star of beta Cep type
  • Variable Star of delta Sct type
  • Variable Star of gamma Dor type
  • Variable Star of Mira Cet type
  • Variable Star of Orion Type
  • Variable Star of R CrB type
  • Variable Star of RR Lyr type
  • Variable Star of RV Tau type
  • Variable Star of SX Phe type (subdwarf)
  • Variable Star of W Vir type
  • White Dwarf
  • Wolf-Rayet Star
  • X-ray Binary
  • Yellow supergiant star
  • Young Stellar Object
  • Young Stellar Object Candidate
Mission
Observation

A lot of spectra has been found ( spectra).

Only the 10 000 first spectra are displayed.

SNR (Max) :
SNR (Max) :
Associated LSD
Detection outsideProbability outside Detection insideProbability inside
Sel Plot Target Simbad Name Type SubType vMagnitude Spectral Type RA DEC Teff Teff's reference Log(g) Log(g)'s reference [Fe/H] [Fe/H]'s reference Rot Rot's reference Distance Distance's reference Radvel Radvel's reference Hour Angle Airmass Inst. Mode UT Date Instrument Stokes Param SNR (Max) RUN ID PI name

Chargement en cours...